Introduction
In this series of articles, we will introduce the steps to concretize actions towards improving Lifetime Value (CLV) by creating customer segments using ECPower.
If you are just starting to use ECPower, or are considering using it, please refer to this as a guide.
First, before setting out to improve CLV, let's start by understanding the current status of your store. In this article, we will explain how to identify the bottlenecks in improving CLV using the KPI analysis function of ECPower.

For more information about ECPower, a customer segmentation tool for e-commerce marketers, please click here.
Defining CLV in ECPower
The definition of CLV in ECPower is as follows:
CLV (Lifetime Value) = Average total purchase amount of a customer over the entire period to date
Compared to the general definition of CLV, it has the following unique features:
CLV based on actual results, not including predictions
Except for certain exceptions such as subscription types, it is difficult to accurately predict when the next purchase will be made in e-commerce. In ECPower, calculations are based on actual results in terms of data reliability and practicality.
CLV based on sales, not profit
Strictly speaking, it is correct to consider CLV on a profit basis. However, for stores with a large number of products or those using various customer acquisition channels, it is very difficult to accurately define cost. As ECPower is a tool for marketers, it adopts sales-based CLV uniformly from the perspective of data usability.
Further Understanding Your Store's CLV
Let's use the Cohort CLV table
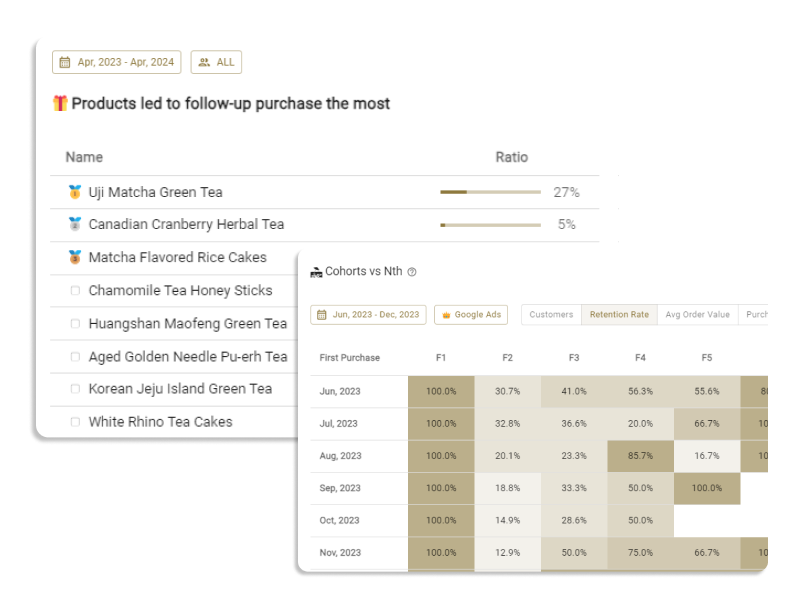
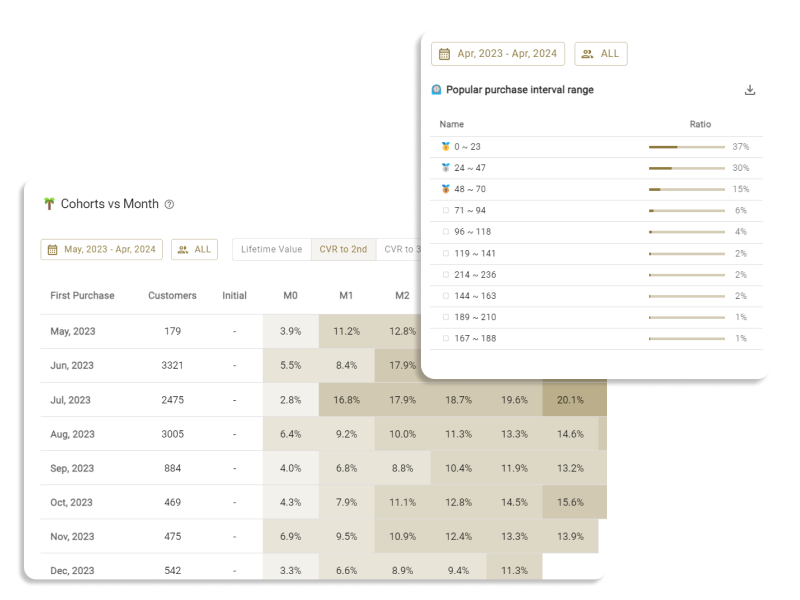
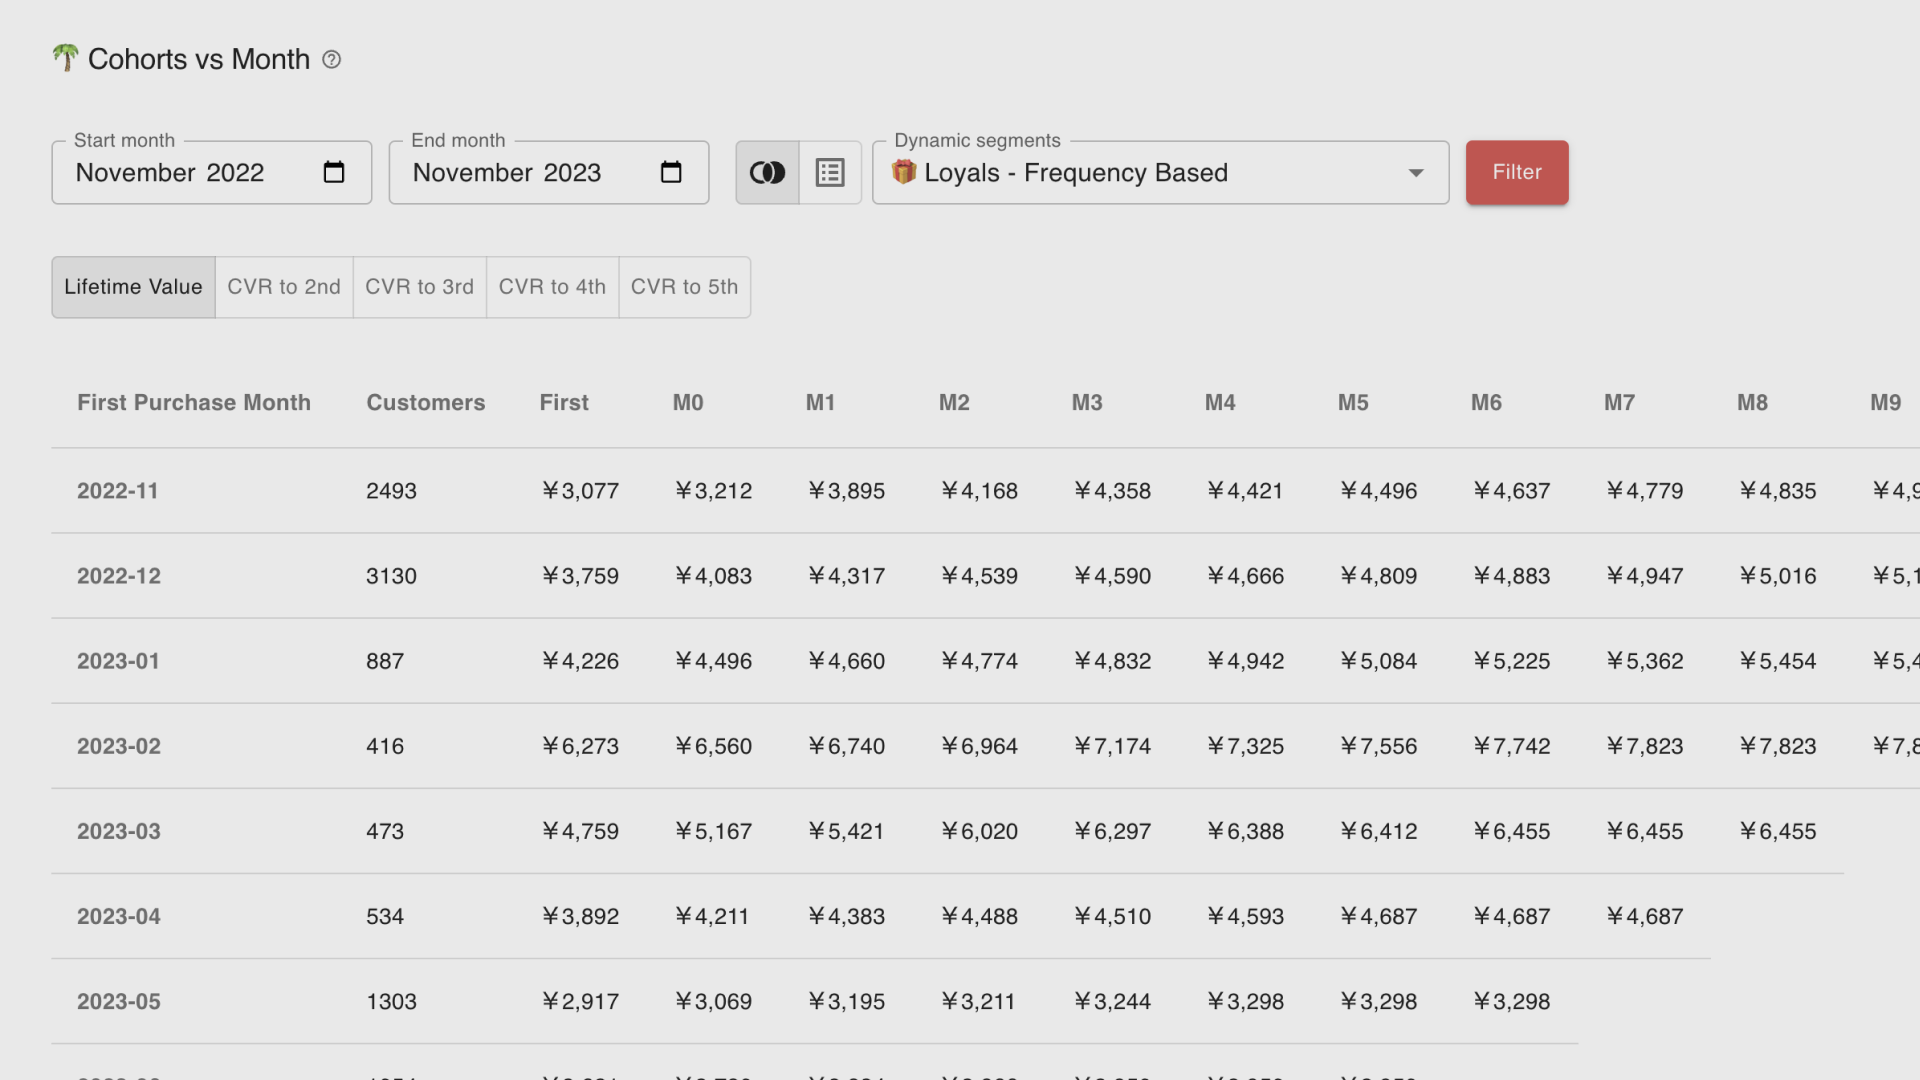
To understand your store's CLV more deeply, use the cohort table in the "KPI Analysis" function. By navigating to KPI Analysis > Monthly Analysis > CLV, the Cohort CLV analysis table will be displayed.

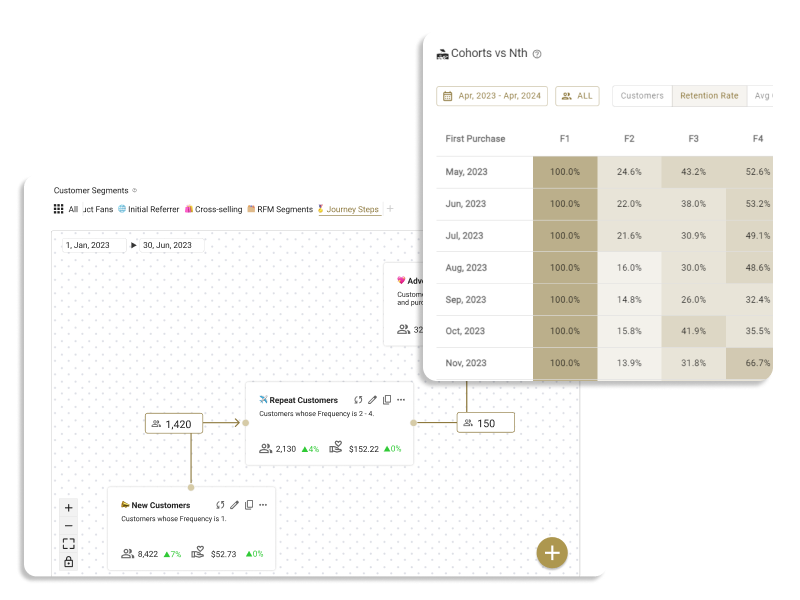
Cohort analysis is a method of dividing customers into groups called "cohorts" and measuring each cohort's behavior over time.
In the Cohort CLV table, customers are grouped based on the month of their first purchase, and the CLV (total purchase amount per customer) at 1 month, 2 months, ...., N months after the first purchase is calculated.
By performing CLV analysis by cohort, you can analyze:
- When does CLV reach a plateau (i.e., when is the rough lifespan of a customer)?
- Whether CLV has been improving over time or not?
While various methods have been proposed to "predict" CLV, this can be said to be the most useful method from the standpoint of reliability and practicality.
Now, using the demo store's Cohort CLV table, we would like to explain how to read the basic table.
Checking When CLV Reaches Its Peak
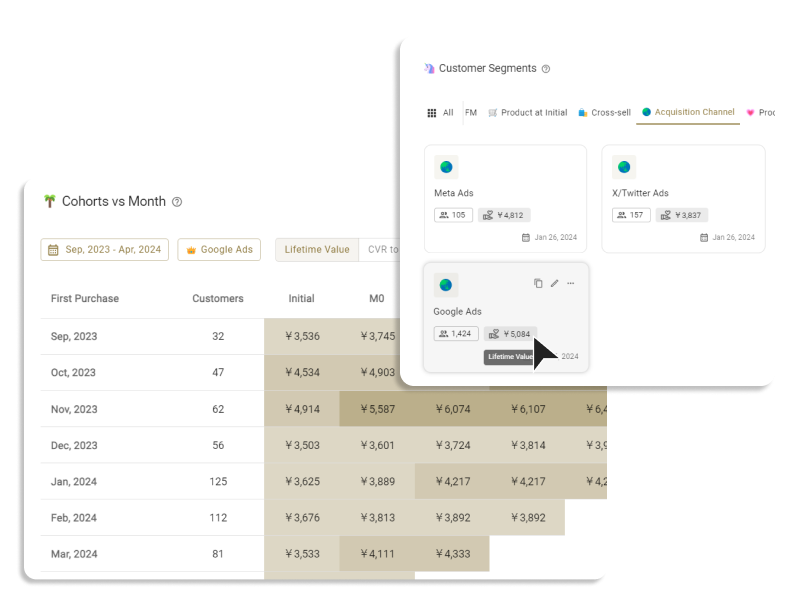
First, let's focus on the cohort that made their first purchase in April 2022.
As you look at the numbers from 1 month, 2 months, ... horizontally, you'll see that the numbers are growing steadily up to the last 11 months. For this cohort, it can be inferred that the CLV is growing on average over 12 months or more.

Next, let's focus on the cohort that made their first purchase in May 2022.
Growth is steady up to the second month, but slows significantly from the third month. For this cohort, it can be inferred that most customers stop buying by the third month.

Finally, let's take a look at the "Overall Period" cohort at the bottom. This is the weighted average (more precisely, a weighted average based on the number of people in the cohort) of all customer data for the specified period.
When averaging the entire period, it seems that we hit a plateau around the 6-7 month mark. We can infer that the April cohort we first looked at was a somewhat exceptional dataset.

*Care must be taken in the latter part of the period, as it is susceptible to individual data. For example, after the 9th month of the "Overall Period", the numbers for CLV have jumped significantly due to the strong influence of the April 2022 cohort.
This way, you can use the cohort table to determine when the CLV will plateau. Extending customer lifetime is an important means to improve LTV. It can be said that the results of "customer lifetime extension strategies" can be judged relatively accurately by "how much the timing of CLV reaching a plateau could be delayed" in the cohort table.
Check whether the CLV is improving over time
Now, a big problem when trying to actually analyze whether the CLV is improving is that there is a "time lag until the actual CLV is determined".
For example, in a store where the CLV plateaus around 12 months, if you want to analyze whether the actual LTV is improving, you have to wait a full year. This makes it difficult, if not unrealistic, to implement the PDCA of marketing measures.
Therefore, a commonly used method is to manage 3-month and 6-month CLV as leading indicators.
First, let's vertically follow the data of "3 months" in the cohort table we saw earlier.
From the May 2022 cohort to the August 2022 cohort, the 3-month CLV is improving as expected. On the other hand, CLV has been on a downward trend since September 2022.

This way, by conducting a fixed-point observation at 3-month and 6-month marks, you can judge whether the CLV is improving as a leading indicator. If you have not yet decided on a KPI management method for improving CLV, please consider adopting this method.
Conclusion
In this article, we explained how to understand when CLV plateaus and whether the CLV improves over X months in chronological order using the cohort CLV table.
So where should we start to actually implement CLV improvement measures?
In the next article, we would like to explain how to identify the bottlenecks for CLV improvement using ECPower.